Welcome back to Teatime! This is a weekly feature in which we sip tea and discuss some topic related to quality. Feel free to bring your tea and join in with questions in the comments section.
Tea of the week: Black Cinnamon by Sub Rosa tea. It’s a nice spicy black tea, very like a chai, but with a focus on cinnamon specifically; perfect for warming up on a cold day.
Today’s topic: Performance Testing with jMeter
This is the second in a two-part miniseries about performance testing. After giving my talk on performance testing, my audience wanted to know about jMeter specifically, as they had some ideas for performance testing. So I spent a week learning a little bit of jMeter, and created a Part 2. I’ve augmented this talk with my learnings since then, but I’m still pretty much a total novice in this area 🙂
And, as always when talking about performance testing, I’ve included bunnies.
What can jMeter test?
jMeter is a very diverse application; it works at the raw TCP/IP layer, so it can test out both your basic websites (by issuing a GET over HTTP), or your API layer (with SOAP or XML-RPC calls). It also ships with a JDBC connector, so it can test out your database performance specifically. It also comes with basic configuration for testing LDAP, email (POP3, IMAP, or SMTP), and FTP protocols. It’s pretty handy that way!

Setting up jMeter
The basic unit in jMeter is called a test plan; you get one of those per file, and it outlines what will be run when you hit “go”. In that plan, you have the next smaller unit: a thread group. Thread groups contain one or more actions and zero or more reporters or listeners that report out on the results. A test plan can also have listeners or reporters that are global to the entire plan.
The thread group controls the number of threads allocated to the actions underneath them; in layman’s terms, how many things it does simultaneously, simulating how many users. There’s also settings for a ramp-up time (how long it takes to go from 0 users/threads to the total number) and the number of executions. The example in the documentation lays it out like so: if you want 10 users to hit your site at once, and you have a ramp-up time of 100 seconds, each thread will start 10 seconds after the previous one, so that after 100 seconds you have 10 threads going at once, performing the same action.
Actions are implemented via a unit called a “Controller”. Controllers come in two basic types: samplers and logical controllers. A sampler sends a request and waits for the response; this is how you tell the thread what it’s doing. A logic controller performs some basic logic, such as “only send this request once ever” (useful for things like logging in) or “Alternate between these two requests”.

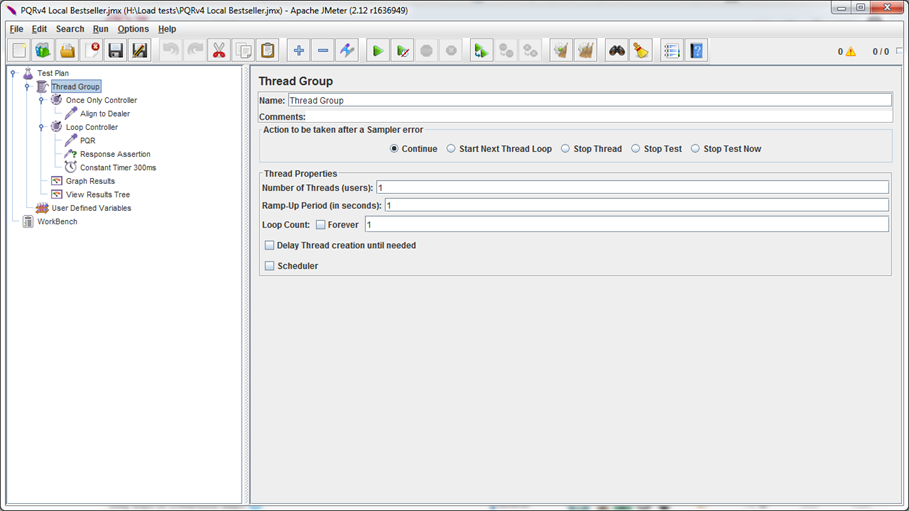
You can see here an example of some basic logic:
In this example, once only, I log in and set my dealership (required for this request to go through successfully). Then, in a loop, I send a request to our service (here called PQR), submitting a request for our products. I then verify that there was a successful return, and wait 300 milliseconds between requests (to simulate the interface doing something with the result). In the thread group, I have it set to one user, ramping up in 1 second, looping once; this is where I’d tweak it to do a proper load test, or leave it like that for a simple response check.

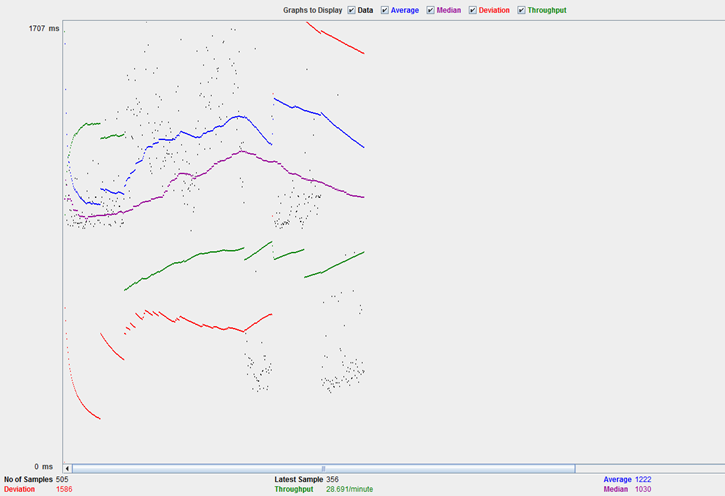
In this test, I believe I changed it to 500 requests and then ran the whole thing three times until I felt I had enough data to take a reasonable average. The graph results listener gave me a nice, easy way to see how the results were trending, which gave me a feel for whether or not the graph was evening out. My graph ended up looking something like this:
 The blue line is the average; breaks are where I ran another set of tests. The purple is the median, which you can see is basically levelling out here. The red is the deviation from the average, and the green is the requests per minute.

Have you ever done anything with jMeter, readers? Any tips on how to avoid those broken graph lines? Am I doing everything wrong? Let me know in the comments 🙂

