
So. We’re up, we’re unit testing, we’re publishing results. But unit testing is only as good as the tests themselves, and that depends heavily on the programmers’ ability to write good tests. Maybe we want more than that. Maybe we want a metric that isn’t essentially self-reported. Maybe we want static analysis.
What is Static Analysis
Static Analysis is a category of testing techniques that covers any metric of code that can be collected without executing the code. These techniques can be used to measure code against an agreed-upon standard without needing anything more from a developer than the code they’ve already written. This is a great way to touch in on the quality of the code when your developers are already over-worked, stressed, and up against the wall; they can put off writing unit tests until “later”, but they can’t prevent you from looking at the code and evaluating it. Obviously, you don’t want to just spring new metrics on people, but once a standard is in place, holding people to it shouldn’t be unreasonable.
Linting with ESLint
The most common static analysis tool you’ll hear JS developers talking about is linting. If you already know about this, feel free to skip down to the practical section, but if you’re picturing the fuzzy stuff that comes out of your dryer after you wash a load of blankets, allow me to dispel the confusion a little. The basic metaphor comes from using a lint roller to clean little bits of lint (or cat hair) off a sweater so you look neater and more presentable. Linting, therefore, is the act of cleaning up little stylistic issues to make the overall code look neat and tidy.
The most widely known linter is JSLint; I believe that’s where the name came from in the first place. You can test out how JSLint works at their website. Notice the checkboxes below the input box; JSLint is configurable, but not overly so. It was designed to enforce the Crockford Conventions, which some JS developers hold to be the best possible standard for Javascript code style. However, as with all things in JS land, the “standard” is hotly debated, and in many places rejected entirely. Therefore, for linting, I prefer a tool called ESLint. Every single rule in ESLint is configurable; at the minimum, this means it has three levels of enforcement: Do not enforce, Warn, or Error. Many rules also have configurable options, such as whether spaces should be before a comma, after a comma, both, or neither.
So let’s say you’ve got ESLint, talked with your team, and come up with a configuration file that enforces your standards. We can fairly simply add that into our gruntfile for Jenkins to execute, using a package like grunt-eslint. However, we now have a problem. Unlike grunt-qunit-junit, grunt-eslint does NOT allow for writing to a file. We’d have to pipe the output, and that includes any output from grunt itself, which might make our file no longer conform to the desired output format without more massaging. So I prefer to install eslint as a standalone console application, as detailed here.
Now our buildfile has two items:
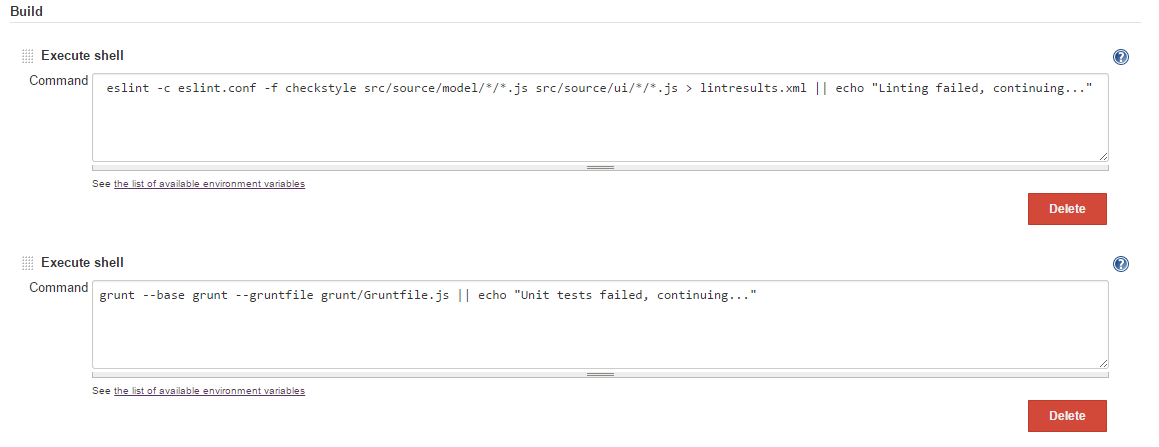
That command line breaks down as follows:
- eslint calls the linter
- -c eslint.conf points it to our custom configuration file
- -f checkstyle outputs the results in checkstyle format. This can be other formats like jslint, junit, or tap, but I found the checkstyle plugin to be to my liking.
- file paths indicate what files should be linted. Here I’m only linting the models and views for my project
- > lintresults.xml is the linux way to pipe the results of the output into a file. This can be any file.
- || echo is, as with last time, a way to ensure that the build does not fail when linting fails. Again, the reporting plugin will take care of marking the build as unstable when the linting fails. Without this, linting errors will prevent Jenkins from moving on to the unit tests.
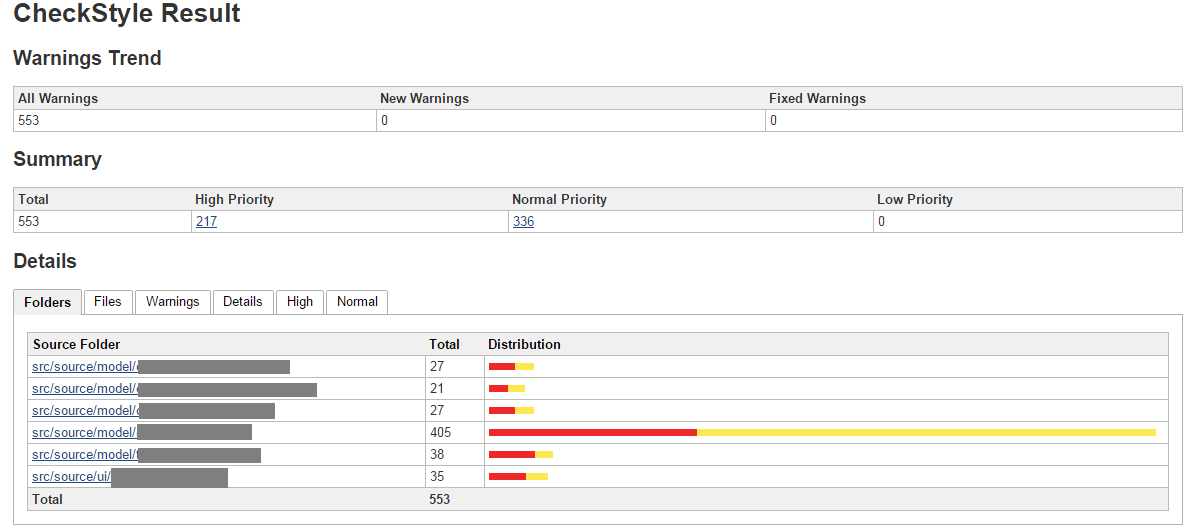
We can then use the Checkstyle plugin (or any other plugin that can process Checkstyle reports) to display the results:
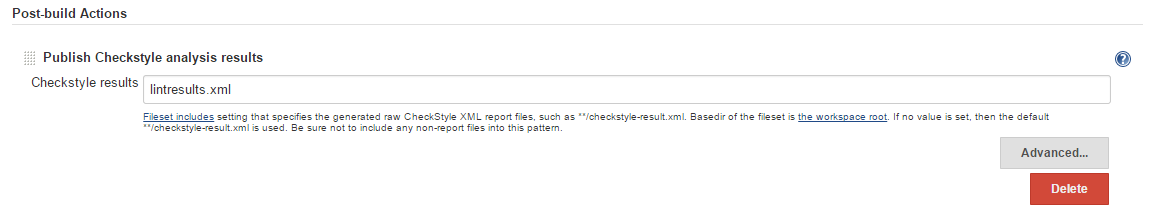
And voila!
Complexity with Plato
Another static analysis that can be useful to shed some light on code quality is complexity analysis. Now, if you’re planning to write angry comments, please keep in mind that all of these metrics measure one aspect of quality, and I don’t believe any of them are infallible be-all end-all measures. But complexity can tell you a little about what parts of your application are going to be more troublesome to maintain.
The most common metric for complexity is cyclomatic complexity. This is a rough measure of code complexity created in 1976 by Thomas McCabe, defined as the count of the number of linearly independent paths through the source code. Basically, this tells you how much branching, looping, and nesting is present in a piece of code. Lower is easier to understand and maintain, but obviously, code with a complexity of 1 doesn’t do very much that’s interesting at all; it’s 100% deterministic, and will always do exactly the same thing, with no change in behavior based on inputs. Your basic “Hello World” program has a cyclomatic complexity of 1; FizzBuzz tends to be around 6 or so.
Another metric of complexity is Halstead Complexity. This is a more robust set of measures proposed in 1977 by Maurice Halstead. These are calculated by counting the number of distinct operators, total number of operators, number of operands, and other such analysis to produce a slew of numbers. One such number is the difficulty index, which is half the number of distinct operators times the total number of operands divided by the number of distinct operands. In theory, this measures how difficult code is to maintain over time.
As both of these metrics are strongly correlated with lines of code, the Maintainability Index seeks to relate them to each other and to the LOC to get an overall quick-and-dirty number to represent how difficult code is to maintain. This index was created in 1991 by Paul Oman and Jack Hagemeister, and it ranges from negative infinity to a “perfect” score of 171, achieved only by an empty file with 0 lines of code. They proposed that code scoring above about 65 should be considered easy to maintain.
These metrics are all measured with a tool called JSComplexity, a tool written by Paul Booth to easily measure the complexity of javascript code. The command-line version of this tool is complexity-report, and there’s a nicely formatted HTML reporter using that tool called Plato. From that we have a Grunt wrapper called grunt-plato, which we can use to generate an HTML report that can be included in Jenkins automatically. Still with me? 🙂
The grunt setup is pretty straightforward, as before. We can add it to our existing file with a few lines:
module.exports = function(grunt) {
  // Project configuration.
  grunt.initConfig({
[...]
   plato: {
    complexity: {
        options: {
        jshint: false
        },
        files: {
        'reports': ['../src/source/model/*/*.js', '../src/source/ui/*/*.js']
        }
    }
    }
  });
  // These plugins provide necessary tasks.
  grunt.loadNpmTasks('grunt-contrib-qunit');
  grunt.loadNpmTasks('grunt-qunit-junit');
  grunt.loadNpmTasks('grunt-plato');
  // Default task.
  grunt.registerTask('default', ['plato','qunit_junit','qunit']);
};
I’ve turned off JSHint because I’m using ESLint above. If you like JSHint, you can leave it included and skip the whole section above about checkstyle.
We already have the grunt file being run by jenkins, so we just add the report like so:
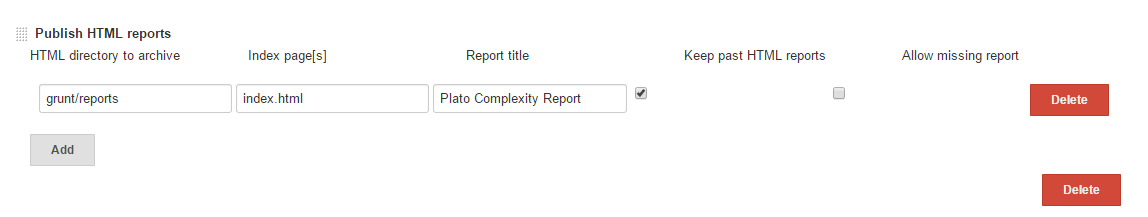 And voila! It’ll appear on the left as a link:
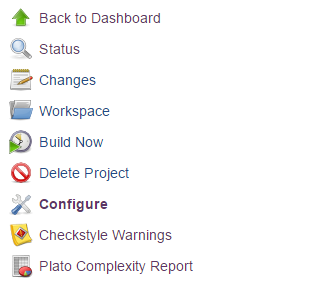
Which takes you right to the report.
Conclusions
There’s a lot more in the world of static analysis that I’d love to be able to show you. There are tools to generate dependency analyses, tools to find common bugs, tools for finding duplicated or dead code, tools to find potential security holes… but unfortunately, the tooling for javascript is rather limited. Compiled languages are always easier to analyse than interpreted ones, and strongly typed languages are easier to analyse than weakly typed ones. Frankly, though, with all the wonders javascript developers are able to produce, I have to wonder: does the community really care about quality? Maybe the tooling is limited because beyond linting and maybe some complexity, javascript developers aren’t interested in writing these kinds of tools.
Maybe I’ll write some myself.